Solar as an Energy Source

The following resources focus on solar as an energy source, specifically its potential in Texas, common barriers to solar PV systems, corporate solar initiatives, and major solar projects across the nation.

How Solar Stacks Up                                                  Corporate Solar Initiatives

Solar Potential & Barriers                                          Major Solar Projects

Evaluate Solar Potential


Solar Compared to Other Energy Sources
Figure 1: 2015 Estimated Finite and Renewable Planetary
Energy Reserves (Terawatt-Years) (IEA).


According to the International Energy Agency (IEA), solar energy is by far the most abundant energy source on earth (see Figure 1). The advantages of solar over other energy sources are many.  It is a clean energy source that produces low levels of emissions while generating electricity.  Compared to conventional energy sources, solar energy's lifecycle greenhouse gas emissions are low (see Figure 2). Solar electric systems have no moving parts, produce no noise and do not require water or fossil fuels to generate electricity.  Moreover, solar panels can be located at the same site where energy is needed, increasing efficiency by reducing losses from transmission and distribution.

Lifecycle Solar Greenhouse Gas Emissions
Figure 2: Lifecycle Greenhouse Gas Emissions Intensity of
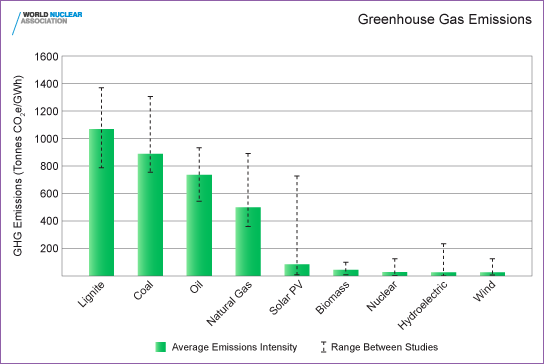
Electricity Generation Methods (World Nuclear Association).


Solar energy is also a significant contributor to the American economy.  Solar jobs have considerably outpaced employment in other energy sectors in recent years.  The U.S. solar industry directly employed 255,037 workers last year, up 9.2% from 2020,  in which 47 states saw job growth in 2021. (IREC). According to the Department of Energy, solar technologies employ 39% of the electric power generation compared to 15% for coal, oil and natural gas power plants.

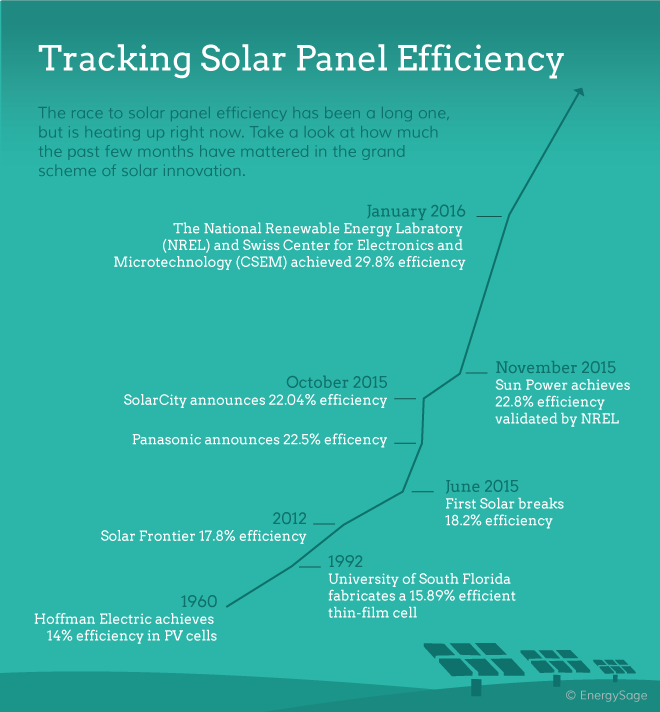
The efficiency of solar panels is also increasing as technology continues to improve.  From 2010 to 2015, average PV module efficiency for residential systems rose from 13.3% to 15.6% (U.S. Solar).  The majority of solar panels on the market today have efficiency ratings of 17 to 21% (Energy Sage). Although, the highest efficiency of any solar panel is 47.1% , which was discovered in April of 2022 (Energy Sage).


Solar Panel Efficiency Graph.
Figure 4: Tracking Solar Panel Efficiency (EnergySage).

According to the U.S. Department of Energy, enough energy from the sun hits Earth every hour to power the planet for an entire year.  Texas alone has enormous technical potential for rooftop solar PV.  Up to 34.6% of the state's annual generation (by percentage of sales) has the potential of being generated by rooftop solar PV systems on all types of buildings (Rooftop Solar). Currently, 4% of Texas’s electricity generation comes from solar energy, as stated by (Comptroller).  Clearly, solar energy is an abundant resource, so why isn’t everything solar-powered already?  Across the nation, certain barriers exist that impede the widespread adoption of solar energy; however, many of these barriers are being removed, especially in Texas.  Many of these barriers can also be overcome through alternative options, like community solar programs that consist of a central installation that provides customers with an opportunity to opt into the solar installation and receive a proportional share of the financial or energy output of the system, thereby allowing customers to realize the benefits of solar energy without requiring a solar installation of their own.  To find out more about other options, click here!

Barrier 1 - Cost & Financing Limitations: Solar panels are a significant financial investment with a long payback period, which can be a deterrent for many households.  However, the cost of solar energy has been steadily falling as technology improves and industry growth continues.  According to the Solar Energy Industry Association (SEIA), the cost of installing solar has dropped by more than 50% over the last decade.


Barrier 2 - Roof Ownership: Solar panels can only be installed on roofs that are owned by the interested party.  If you live in a multifamily residence or rent your home like over 35% of DFW-area residents do, you most likely will not be able to install solar panels on your roof unless your landlord or property manager is also on board with solar energy (U.S. Census Bureau Fact Finder).  However, you can still consider other solar options!

Barrier 3 - Roof Condition, Orientation, Height & Size: The condition, orientation, height, and size of your roof can all play a major role in determining whether solar panels are feasible.  Roofs must be in good condition and have the ability to support the weight of solar panels.  The PV array and aluminum mounting rack weighs approximately 2.5 pounds per square foot (Dan Lepinsky, 2016). For the average 5kW PV system that requires about 450 square feet of roof space, the system will weigh 1,125 lbs (Calculate how many solar panels you need for your home). In addition to supporting the weight of the panels, the roof surface must be facing south, east, southeast, west, or southwest to receive enough sunlight to generate significant quantities of electricity.  If a building is four or more stories high, a crane might be required for solar panel installation.  Furthermore, roofs must have enough space for the PV system to be installed as well as to comply with fire and safety code standards.  For high-rise buildings, the roof size often provides insufficient space for the quantity of solar panels needed to service all tenants' electricity needs (NREL, Shared Solar).  Again, alternative options are a great way of overcoming these barriers! 

DOE Solar Prospector

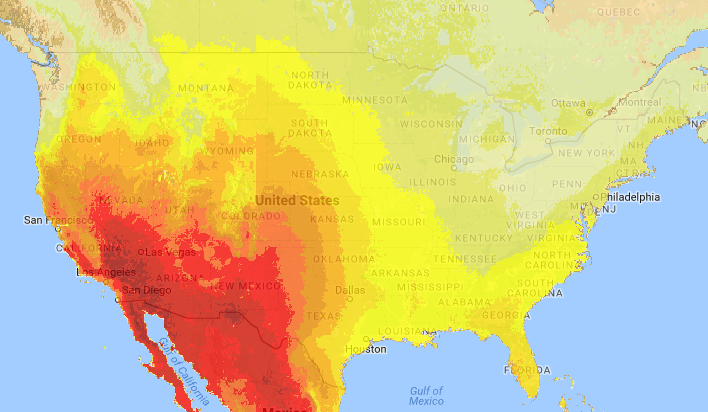
Local and national solar potential can be evaluated using federal tools including the EPA RE-Powering Mapper and the NREL's Solar Prospector (works best using Google Chrome or Mozilla Firefox browsers). Both tools are designed to identify sites suitable for solar installations; the Solar Prospector is focused on suitability for utility-scale solar plants.

The EPA RE-Powering Mapper is available for use with Google Earth, or the data can be downloaded as a GIS shapefile. For links and instructions on both, visit RE-Powering Mapping and Screening Tools.

NCTCOG has used the RE-Powering Mapping Tool to create maps of solar energy potential within each regional boundary across the state of Texas. Check out the map of the Permian Basin Regional Planning Commission for a closer look at what information is available! To request the data or map, contact us!


Top U.S. corporations are also pursuing solar energy.  The top ten corporate solar users command over 8 gigawatt (GW) of solar capacity nationwide.  Check out SEIA’s Solar Means Business 2022 report for more information!

Source: SEIA Solar Means Business 2016.


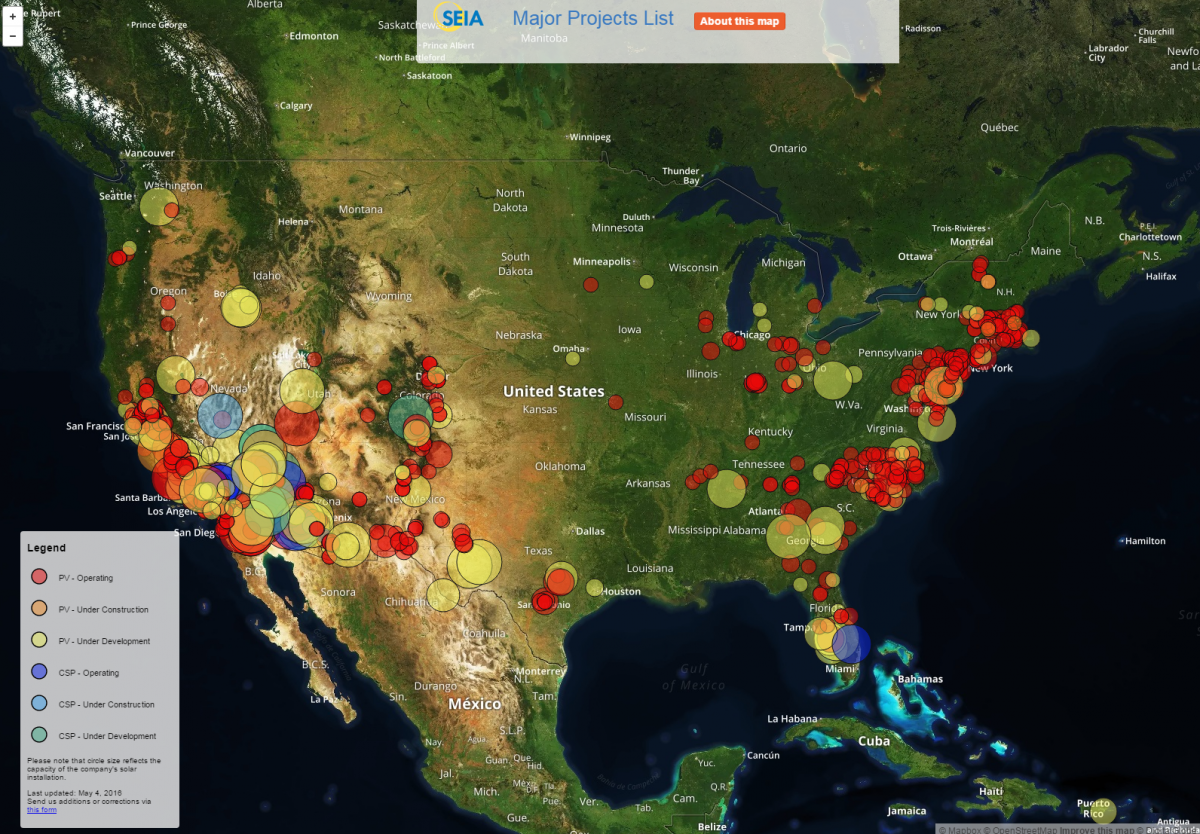
To view major solar projects across the United States, check out SEIA Solar Mapping’s Major Solar Projects List!


Sources

Comptroller. "Texas’ Energy Profile" (September 2022).

Dan Lepinksy. "Solar PV for Fire & Code Officials." (Summer 2016).

Department of Energy. "U.S. Energy and Employment Report 2022." (June 2022).

Energy Sage. "How solar panel cost and efficiency have changed over time" (Febuary 2022).

EnergySage. "The Most Efficient Solar Panels In 2023 | EnergySage" (May 2023).

Environmental Protection Agency (EPA). "How to Identify Sites" (May 2023).

Environmental Protection Agency (EPA). "RE-Powering America's Land" (March 2023).

International Energy Agency (IEA). "Solar Update Vol. 62." (November 2015).

Interstate Renewable Energy Council (IREC). "National Solar Jobs Census 2021." (2021).

National Renewable Energy Laboratory (NREL). "Innovative Data Energy Applications" 

National Renewable Energy Laboratory (NREL). "Rooftop Solar Photovoltaic Technical Potential in the United States: A Detailed Assessment" (January 2016).

National Renewable Energy Laboratory (NREL). "Shared Solar: Current Landscape, Market Potential, and the Impact of Federal Securities Regulation" (April 2015).

National Renewable Energy Laboratory (NREL). "U.S.Solar Photovoltaic System Cost Benchmark: Q1 2016". (September 2016).

North Central Texas Council of Governments (NCTCOG). "Distributed Use of Solar Energy: Multiple Perspectives - Community Solar" (December 2016).

Solar Energy Industries Assosiation (SEIA). "2022 Solar Means Business Report" (2023).

Solar Energy Industries Assosiation (SEIA). "Major Solar Projects List" (May 2023).

Solar Energy Industries Assosiation (SEIA). "Solar Industry Research Data" (2023).

SolarReviews. "Calculate how many solar panels you need for your home" (January 2023).

Texas Solar Power Association. "Solar in Texas: Current Status and Future Projections" (February 8, 2017).